▷ Display of last 24 hours of Temperature, Humidity and Temp. CPU


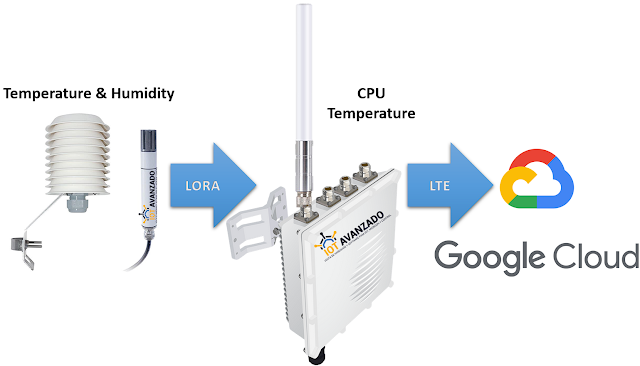
For this post, two sensors have been deployed for real-time data collection, currently operational in the city of Guayaquil: one for humidity and another for temperature. Both sensors utilize LoRA technology to transmit collected information to a Gateway. This Gateway serves as a central connection point, receiving data from the sensors and forwarding it to the Google Cloud platform via LTE cellular connectivity. Leaflet viewer with OpenStreetMap

Leaflet viewer with OpenStreetMap


Once the data is stored on the Google Cloud platform, a customized web interface has been developed. This interface facilitates the visualization and analysis of the sensor-collected data, offering users a clear and easily accessible representation.

In today's interconnected world, the ability to gather and visualize real-time data is essential for understanding and making informed decisions. On this occasion, we will explore how to visualize the data from the last 24 hours of various variables captured by IoT devices using Google and Chart.js.


The provided code is a key component for this purpose. It integrates with the Google API to access and process data stored in a specific spreadsheet.

This code allows for the creation of dynamic charts for three distinct variables collected by IoT sensors: temperature, humidity, and CPU temperature. Through the Chart.js library, clear and concise visualizations are generated that display the evolution of these variables over time.

The magic happens when filtering the data to display only the information from the last 24 hours. This is achieved using JavaScript to select and present only the most relevant data, thus providing a specific and updated view of the behavior of the monitored variables.

Some important aspects of the code include:

  • Use of the Google API to retrieve data.
  • Filtering of data based on a specific time period (in this case, the last 24 hours).
  • Creation of dynamic and clear charts with Chart.js.
  • Visualization of temperature, humidity, and CPU temperature data in three separate charts for better understanding.

This integration between Google, JavaScript, and Chart.js provides a powerful and flexible way to efficiently monitor and visualize IoT data in a user-friendly manner.

Feel free to try this out and adapt it to your own IoT datasets! The customization and expansion capabilities are vast, allowing for the inclusion of more variables, design adjustments, and much more..
Last 24h visualization of each variable from Google Cloud

Last 24h visualization of each variable from Google Cloud


Read related topics

Comments

Popular posts from this blog

▷ Enhancing Energy Efficiency with Learning-based Consumption Prediction

  ✅  Keywords : ➡️ #EnergyConsumptionPrediction #Energy #ESP32 #PZMT004 #OpenSource #OpenHardware #RegressionLearner #SustainableEnergyInformation #DataCenter  #NodeRed #EmbeddedSystems #MIcrocontroller #Phyton #MQTT #MySQL #Telegram ✅ Introduction: In this edition, we explore a groundbreaking research study titled "Learning-based Energy Consumption Prediction" conducted by our team of experts. We delve into the challenges posed by the increasing influx of data into cloud-fog infrastructures and the pressing need for sustainable energy consumption management. Our researchers have developed an energy consumption prediction model, focusing on hardware design, data pre-processing, and machine learning techniques. Join us on this journey as we discuss the methodology, findings, and future prospects of this pioneering study. ✅ Content: In our study, titled "Learning-based Energy Consumption Prediction," we address the critical issue of managing energy consumption in serv

▷ The Social Cognitive Theory #SCT applied to reduce sedentarism in citizens

➡️  #SCT #SocialCognitiveTheory #Sedentarism Sedentarism is a growing concern in today's society due to its negative effects on health and well-being. However, the Social Cognitive Theory offers a solution to reduce it through a series of strategies based on human behavior. ➡️ According to this theory, human behavior is influenced by social perception, that is, how we perceive others and how they perceive us. In the case of sedentarism, one way to reduce it is through the creation of a social culture that values and promotes physical activity. ➡️ One way to achieve this is through education and awareness about sedentarism, physical activity, nutrition, quality of life, among other health-related aspects. Creating awareness campaigns about the importance of maintaining an active lifestyle can help influence social perception and motivate people to change their sedentary behavior. ➡️ Another strategy is the creation of programs and physical activities that are accessible and attracti

▷ The Importance of Energy Consumption Prediction in Data Centers

➡️  #EnergyConsumption #EnergyPrediction #DataCenter In the digital age, data centers are a key piece of the technological infrastructure that drives the global economy. From managing large databases to cloud services, these centers consume large amounts of energy, making it crucial to have a good energy consumption prediction. Here we will explain why it is important to have a good energy consumption prediction in data centers. ➡️ Reducing Costs Energy consumption in data centers can be a significant cost for companies. Therefore, it is important to have a good energy consumption prediction to be able to plan and control costs efficiently. A good energy consumption prediction will allow companies to allocate budgets and plan appropriately, which will help reduce long-term costs. ➡️ Reducing Environmental Impact In addition to costs, data centers also have a significant impact on the environment. Generating energy for data centers often involves burning fossil fuels, contributing to gr

▷ Adafruit #HUZZAH32 - #ESP32 Feather

➡️  #ESP32 #HUZZAH32 #Feather #dafruit El #HUZZAH32 es módulo de desarrollo basado en #ESP32, hecha con el módulo oficial WROOM32. Este hardware contiene: convertidor USB a serie incorporado, reinicio automático del cargador de arranque, cargador de iones de litio / polímero, y casi todos los GPIO que sacaste para que puedas usarlo con cualquiera de nuestras alas de plumas. El  ESP32  es una actualización perfecta del ESP8266 que ha sido tan popular. En comparación, el ESP32 tiene mucho más GPIO, muchas entradas analógicas, dos salidas analógicas, múltiples periféricos adicionales (como un UART de repuesto), dos núcleos para que no tenga que ceder ante el administrador de WiFi, procesador de mayor velocidad, ¡etcétera etcétera! Creemos que a medida que el  ESP32  obtenga tracción, veremos a más personas moverse a este chip exclusivamente, ya que tiene todas las funciones.  ✅   Overview :  240 MHz dual core Tensilica LX6 microcontroller with 600 DMIPS Integrated 520 KB SRAM Integrated 8

▷ SD3031 Precision #RTC Module for #Arduino

  ➡️  #RTC #Arduino #DFRobot About this item This real-time clock #RTC module uses the SD3031 chip, which has an integrated crystal oscillator and temperature compensator. This provides high-precision timing and stability. At a temperature of 25 °C, the accuracy is maintained at ±3.8ppm (±0.32832 seconds/day). The SD3031 can be powered by button-cell batteries. This allows for accurate timing even when the main power source is interrupted. The RTC keeps track of seconds, minutes, hours, days of the week, dates of the month, and months and years. It also automatically adjusts the date at the end of each month and includes leap year corrections. The SD3031 has a built-in 70-byte SRAM for low-power data storage. Please note that due to recent air cargo regulations, special items such as batteries, magnets, and liquids are strictly audited for air transport. As a result, the RTC module does not come with batteries. You will need to purchase them locally. The button cell model that is compa

▷ Gesture Recognition Touch Sensor

  ➡️  #GestureRecognition #TouchSensor #DFRobot About this item This sensor module integrates gesture recognition and touch detects functions in one piece, and provides an adjustable detection range within 0~30cm. When connected to your microcontroller, it can detect 5-way touch signal and 7 kinds of gestures: move left, move right, move forward, move backward, pull up, pull down, pull and remove. The sensor is equipped with the function of auto-sleep and wake up. The module comes with the gesture recognition algorithm and provides simple and reliable data output. Use the sensor to directly communicate with upper computer or micro-controllers like Arduino and Raspberry Pi via serial port. The onboard 5-way touch pad on the sensor can be directly used to detect touch, or you can extend the touch pad with wires to make it perfectly fit in your application. The outer shield for the sensor retains the advantages of Gravity series as well as makes the sensor more durable. This sensor can be

▷ Data visualization: of Temperature, Humidity, and CPU Temp.

  For this post, two sensors have been deployed for real-time data collection, currently operational in the city of Guayaquil: one for humidity and another for temperature. Both sensors utilize LoRA technology to transmit collected information to a Gateway. This Gateway serves as a central connection point, receiving data from the sensors and forwarding it to the Google Cloud platform via LTE cellular connectivity. Leaflet viewer with OpenStreetMap Leaflet viewer with OpenStreetMap Once the data is stored on the Google Cloud platform, a customized web interface has been developed. This interface facilitates the visualization and analysis of the sensor-collected data, offering users a clear and easily accessible representation. In this post, we'll explore how to visualize real-time data from Google Cloud using JavaScript and the powerful charting library, Chart.js. The goal is to create an interactive environment that visually

▷ Advancements in Device-Free Indoor Localization Using Machine Learning and 28 GHz Band Technology

  ✅  Keywords : ➡️ #MillimeterWave #MMwave #28GHz #IndoorLocation #WirelessInSite #Remcom #Matlab #ML #MachineLearning #AI #ArtificialIntelligence #RegressionLearner #Classification ✅ Introduction: In this edition of our newsletter, we delve into groundbreaking research exploring the realms of device-free indoor localization techniques. Utilizing the power fluctuations in a communication link due to the presence of a human body, our researchers have employed advanced machine learning methods in the 28 GHz band. This innovative approach aims to redefine indoor positioning, offering unprecedented accuracy and efficiency. ✅ Content: In our quest to enhance indoor localization technology, our research team conducted comprehensive studies. Through meticulous simulations and experiments, we evaluated the potential of machine learning algorithms in the 28 GHz band, focusing on the effects of human presence within an enclosed space. 1. Database Construction and Simulation: Our researchers meti

▷ The Importance of Soft Processors in #FPGAs for Customized Digital Circuits

➡️ #FPGA #VHDL  #SoC # System-on-Chip  #Processor #SoftProcessors #DigitalCircuits #DigitalSystems FPGAs (Field-Programmable Gate Arrays) are programmable electronic devices that allow for the creation of customized digital circuits. Unlike ASICs (Application-Specific Integrated Circuits), which are integrated circuits specifically designed for one application, FPGAs can be programmed and reprogrammed to perform different tasks. ➡️  One of the most important advantages of FPGAs is their ability to implement soft processors, which are processors that are implemented in the FPGA using a hardware description language (HDL). Soft processors allow designers of integrated systems to create more complex and flexible systems than would be possible with conventional integrated circuits. ➡️  The importance of using soft processors in FPGAs lies in the ability to create highly customized integrated systems, tailored to specific user needs. Soft processors can be optimized for a specific task, whi